Heart Rate
The Heart Rate Monitor is a MAX30105 sensor that shines a light onto your skin and checks the light coming back from that. The light will vary with the amount of blood and from that we can figure out a pulse rate as long as we check it often enough.
Given a real time pulse rate we can do some other things too:
- Log it to the SD card. This happens every 10 minutes. You can make it more often but be aware that writing a lot of entries on the SD card will use up space, also the SD card uses a surprising amount of power.
- Figure the variance of the intervals between pulses. Heart specialists like to know this kind of thing and the general idea is that this should vary rather than remain constant. People with a very constant interval time are usually ill. This is plotted on a poincare plot and the ideal is a spread of values rather than a narrow cluster of them.
- Display the pulse rate, obviously, but we can also graph the input data that derived it.
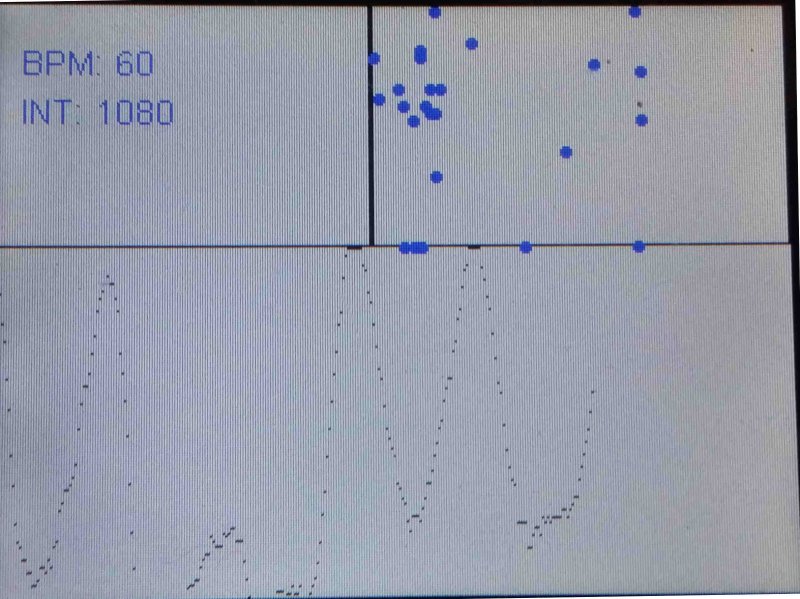
This is what the graph looks like:
Top left is the actual heart rate (60 beats per minute) and the last interval in milliseconds. Along the bottom are the values coming in from the MAX30105 on a plot and you can see the pulses in the graph. Upper right is the poincare plot showing a reasonable spread of values, so I am quite healthy. That poincare plot will count the number of hits on the same point and change colour as they accumulate. If you leave it on long enough you'll se the popular points change from blue to green and then red and yellow.
The lower graph is difficult to get right because it needs to dynamically scale accoding to the values coming in to gove you a decent looking plot. Often the first pass looks a bit crazy while it figures out where the min and max of the data is, then it comes right and looks pretty good. So the picture here shows about the 4th pass.
HeartRateMonitor.cpp
This is the app and most of the code is in the display() method which is called every 2000useconds, or 2ms. Recall this is controlled by returning the needed value in the getUpdateInterval() for the app.
The display() method pulls its values from HearRateInterrupt which keeps track of the BPM, interval and the last y value from the MAX30105. Past that it is fairly stright forward display logic. The only complications are the calls to figureScale() which examines an array of previous values to find the min and max of them and then calculate a scale based on the screen size.
So now it is time to look at the HaertRateInterrupt class.
HeartRateInterrupt
The Interval for heart rate is called every 10 milliseconds, and that ends up calling the HeartRateInterrupt's calculate() method. This used to be a hardware interrupt and the argument (signal) is no longer used.
calculate() calls particleSensor.getIR() to get a value from the MAX30105. The processPulse() method processes that value and all we do after that is figure a rolling average of the MAX30105 value. This is so we can provide a lastY value for the graph.
processPulse() first calls checkForBeat() which examines the stream of values we have so far and decides if we had a pulse beat. checkForBeat() code is in the MAX30105 library so I won't describe it. If processPulse() decides there has been a beat then we figure the interval and the BPM. We do a little averaging to smooth out crazy values and record the result as the current BPM. We also monitor the effects flag here. If it is on then for every beat we detect we click the speaker and flash the LED.
The effects flag is toggled by the HeartRateMonitor app which reacts to touches on the screen.
 Madura Software
